Energy management
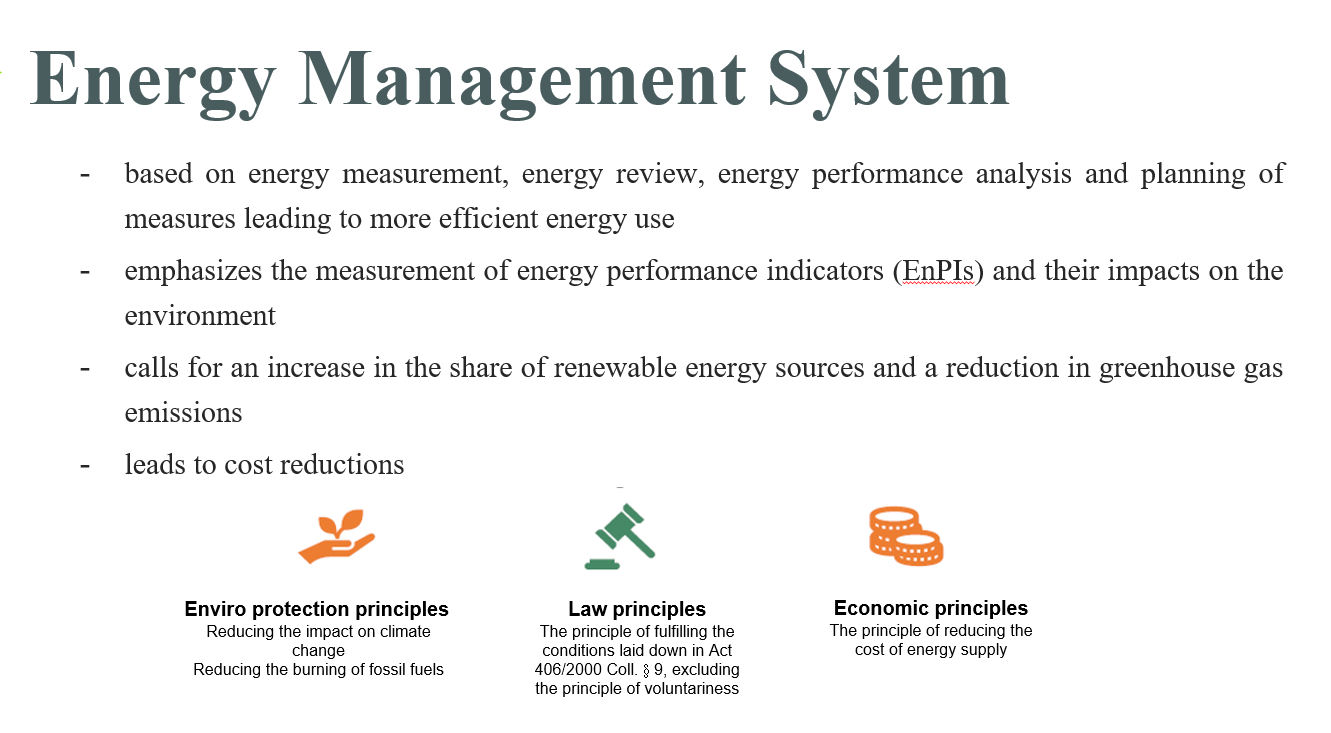
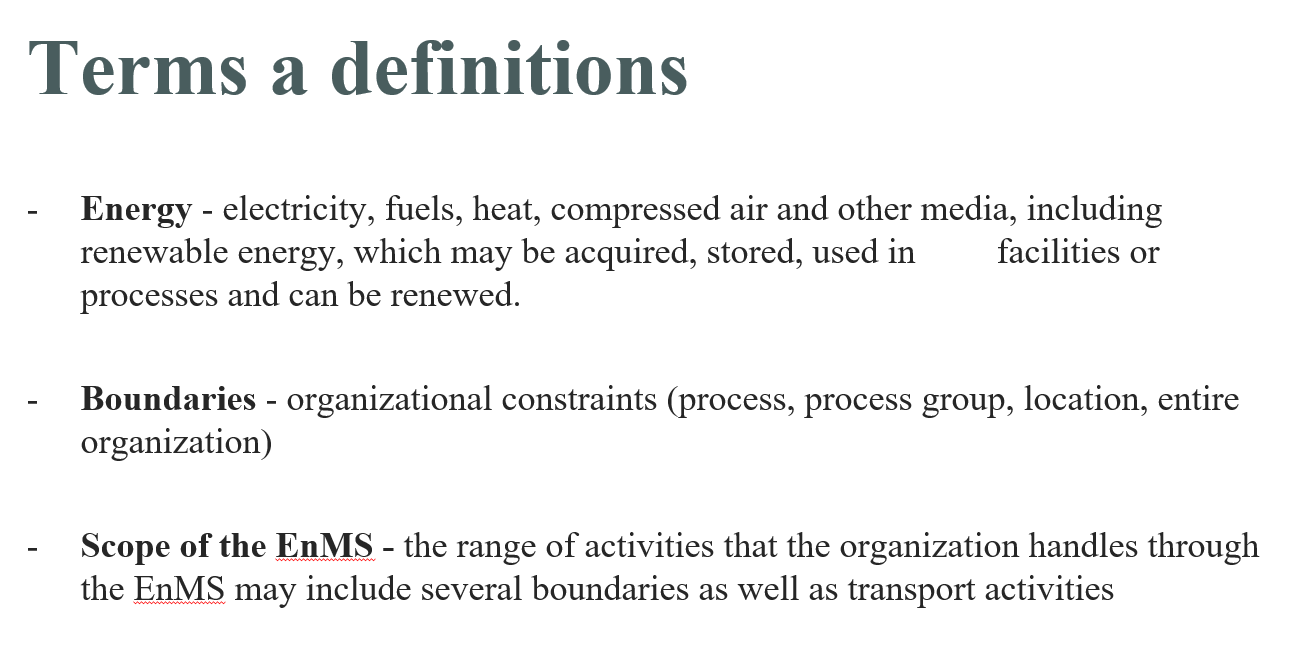
Wistron introduced the ISO 50001 Energy Management System to ensure systematic management of energy. With our effective management system and real-time energy dashboard, Wistron works to identify and review energy-intensive hotspots, using results to develop energy projects. We regularly convene energy project meetings and follows up on related progress and results. We seek to continue to improve energy efficiency through the exchange of information between plants.
The energy review process is conducted annually in accordance with the ISO 50001 Energy Management System. Each year, we review the types and amounts of energy used within the defined boundaries. By utilizing smart meters and energy management dashboards, we identify significant energy uses and establish or adjust energy baselines for these significant energy uses. We also set or revise corresponding energy performance objectives, propose improvement plans, implement energy-saving actions, and track performances. In the event of significant changes to facilities, systems, or processes, energy baselines and targets are updated accordingly.
The energy review process is conducted annually in accordance with the ISO 50001 Energy Management System. Each year, we review the types and amounts of energy used within the defined boundaries. By utilizing smart meters and energy management dashboards, we identify significant energy uses and establish or adjust energy baselines for these significant energy uses. We also set or revise corresponding energy performance objectives, propose improvement plans, implement energy-saving actions, and track performances. In the event of significant changes to facilities, systems, or processes, energy baselines and targets are updated accordingly.
.PNG)
Energy Management Training
Wistron is committed to ESG actions. For energy management, we've adopted a two-pronged approach of promoting energy conservation projects and advocating for energy conservation. By implementing energy management measures and encouraging employees to take part in energy conservation activities, we form a company-wide consensus to contribute to environmental protection.


Energy Usage
- Total non-renewable energy consumption: 223,828.56 MWh in 2021; 179,859.75 MWh in 2022; 151,773.28 MWh in 2023; 128,201.10 MWh in 2024
- Total renewable energy consumption: 209,706.55 MWh in 2021; 261,154.18 MWh in 2022; 252,373.69 MWh in 2023; 299,411.85 MWh in 2024
Energy Performance Indicators
| Type | Unit | 2021 | 2022 | 2023 | 2024 |
|---|---|---|---|---|---|
| Electricity consumption per unit revenue | MWh/NT$ 1B | 616.11 | 587.06 | 574.31 | 581.68 |
| Percentage of renewable energy in electricity consumption | % | 52.79 | 65.26 | 66.47 | 74.74 |
- Note 1: 2024 performance indicators are based on energy use/Wistron Group revenue from Wistron and subsidiaries listed in consolidated financial statements (excl. Wiwynn and its subsidiaries)
- Note 2: Percentage of renewable energy in electricity consumption : (Self-generation and self-consumption of renewable energy + Purchased renewable energy ) / Total electricity consumption
- Note 3: Energy consumption outside of the organization (Scope 3): 66,337.22(GJ)


